How to choose and use AI agent monitoring tools for reliable production systems
Key Takeaways
Reliable agent operations begin with visibility into the full workflow, not just the final answer.
- Trace every meaningful step, decision, model call, and tool invocation.
- Measure task success alongside latency, token use, cost, and failure rates.
- Use structured events and session context to make investigations faster.
- Protect prompts and user data with deliberate privacy and access controls.
- Treat monitoring as a production workflow that supports regular evaluation and improvement.
Understand what AI agent monitoring tools need to track
AI agents do more than return a response. They interpret a goal, choose actions, call tools, inspect results, and sometimes repeat the process before completing a task. That makes end-to-end visibility the starting point for reliable operations. AI agent monitoring tools should help a team understand both what happened and why the run produced its result.
Agent steps, decisions, and task completion
A useful trace follows an agent from the initial request through each intermediate step. Record the planned action, the decision that selected it, the result, and the point at which the task was considered complete. This gives operators a practical way to separate a poor final answer from an earlier planning or execution error.
Task completion also needs a clear definition. A successful run might mean that an email was drafted, a record was updated, or a research brief met a set of criteria. Without that definition, a dashboard can report healthy activity while the agent quietly misses its business goal.
Model inputs, outputs, and tool calls
Capture the context the model actually received, including relevant instructions, retrieved material, parameters, and the resulting output. Tool calls deserve the same attention: the chosen tool, arguments, response, and any validation performed afterward. This is often where an apparently reasonable answer starts to go wrong.
The goal is not to expose private chain-of-thought. It is to preserve operational evidence: prompts, outputs, control-flow events, tool activity, and error details that let a team reproduce and assess a run safely. A practical observability guide offers a useful framing for inspecting multi-step agent activity.
Latency, cost, and token consumption
Performance is more than response time. A run may be fast but expensive, or inexpensive but too slow for the workflow it supports. Track duration for the whole task and for individual model and tool calls, then connect token consumption and other usage data to the same session.
Per-task cost is especially useful for business owners. It reveals which workflows are worth automating and exposes inefficient loops before they become budget problems. Set a baseline during normal operation, rather than judging every run against an arbitrary global limit.
Failures, retries, and unexpected behavior
A failed task is only one kind of failure. An agent can select the wrong tool, retry a request repeatedly, return a plausible but unsupported answer, or stop early after receiving an incomplete result. Monitoring should preserve enough context to identify these patterns instead of reducing them to a generic error count.
Review retry counts, tool errors, timeouts, abandoned sessions, and unusual action sequences together. When an incident occurs, compare it with successful traces using the same workflow version. That comparison often points to a change in input, dependency behavior, or agent instructions.
Build an observability strategy for AI agents
Observability is an operating practice, not a single dashboard. The strategy should connect technical signals with the session and business outcome they belong to. Teams that establish this structure early spend less time reconstructing events from scattered application logs later.
Logs, traces, and session-level context
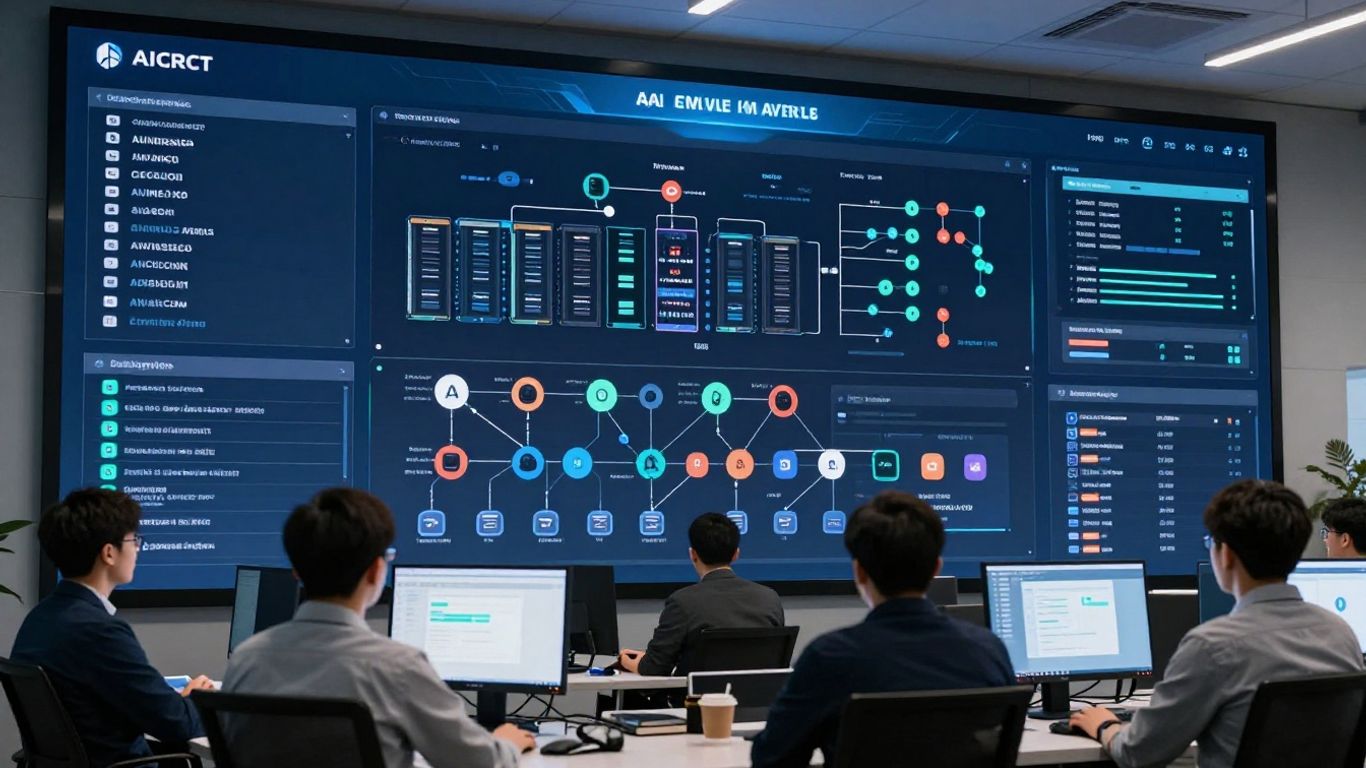
Logs answer what was recorded, while traces show how events fit together in one run. For an agent, the trace should group model calls, tool calls, handoffs, retries, and final outcomes under a session or task identifier. Session context then lets an operator inspect a multi-turn interaction without losing the sequence.
Keep the raw events detailed enough for investigation, but make common questions easy to answer: Which step failed? Which tool was called? How long did it take? Did the user retry the request? This balance makes monitoring useful during an incident and during ordinary review.
Structured events and metadata standards
Free-form logs are difficult to compare. Define a small event vocabulary for actions such as model request, tool request, tool result, approval, retry, error, and completion. Add consistent metadata for agent version, workflow, environment, model, tenant, session, and correlation identifiers.
A standard does not need to be elaborate to be valuable. The main requirement is consistency across agents and releases. Once events share the same shape, teams can filter incidents, build service-level views, and compare quality by workflow rather than reading individual transcripts.
Correlating agent activity across tools and services
Most production agents depend on more than a model provider. They may call a database, queue, browser, CRM, or internal API. Correlation IDs should travel across these boundaries so an agent trace can be connected to the surrounding service activity.
This also clarifies ownership. A slow tool response should not be mistaken for model latency, and an authorization failure should not look like an agent reasoning problem. A unified operational view is one reason teams exploring AI agent observability focus on traces that cover the complete workflow.
Balancing visibility with privacy requirements
More data is not automatically better monitoring. Prompts and tool results can contain personal information, credentials, customer records, or confidential business material. Decide what may be stored, what must be masked, and how long each class of data should remain available before instrumenting production traffic.
Use redaction at collection points where possible, and distinguish searchable metadata from sensitive payloads. Access should follow job responsibilities, with audit records for investigations and exports. Privacy controls are part of observability design, not a later cleanup task.
Measure AI agent quality and reliability
Technical health signals cannot tell you whether an agent did the right thing. A system can have excellent uptime while producing incomplete research, misclassifying requests, or taking an action that requires human review. Quality measurement therefore needs both operational telemetry and evidence about the outcome.
Accuracy, task success, and goal completion
Start with a measurable definition of success for each workflow. For a scheduling agent, that might include correct participants, time, and confirmation. For research, it could include factual support, required coverage, and a usable format. The definition should be specific enough for a reviewer or evaluator to apply consistently.
Track completion rates by workflow and failure type rather than relying on a single quality score. A task that finishes is not necessarily a task that satisfies the user. Segmenting results by agent version, input type, and tool path makes improvement work more targeted.
Hallucinations, unsafe actions, and policy violations
Monitor unsupported claims and actions that exceed the agent's authority. An answer may sound confident while relying on information absent from the available context. An action may be technically valid but violate a permission boundary or a business policy.
Use validators and approval steps where the risk warrants them. Record whether a response was grounded, whether a tool argument passed its checks, and whether a human intervened. These signals create a defensible record without pretending that one automated score captures every kind of risk.
Human feedback and user satisfaction
Users often notice quality problems that infrastructure metrics miss. Give them a simple way to report an incorrect result, an unnecessary step, or an action they did not expect. Link that feedback to the relevant session so reviewers can inspect the underlying trace.
Qualitative comments are useful when grouped into themes. A rise in complaints about missing context suggests a different fix from complaints about slow completion or excessive clarification. Review feedback alongside task success and cost to avoid optimizing one measure at the expense of the experience.
Evaluation datasets and regression testing
A small, representative evaluation set gives each release a stable point of comparison. Include ordinary requests, edge cases, ambiguous instructions, tool failures, and inputs that should trigger a refusal or escalation. Keep expected outcomes versioned with the workflow and its instructions.
Run the set before deployment and after meaningful changes to prompts, models, tools, or permissions. Production traces can supply new examples, but they should be reviewed and sanitized before entering the dataset. This turns monitoring from passive observation into a feedback loop.
Compare AI agent monitoring tools
The right choice depends on the risks and operating model of the agent, not on the longest feature list. A small internal workflow may need simple traces and cost reporting, while a customer-facing system may require access controls, retention rules, evaluations, and incident workflows. Compare tools against the questions your team must answer during a real failure.
Tracing and debugging capabilities
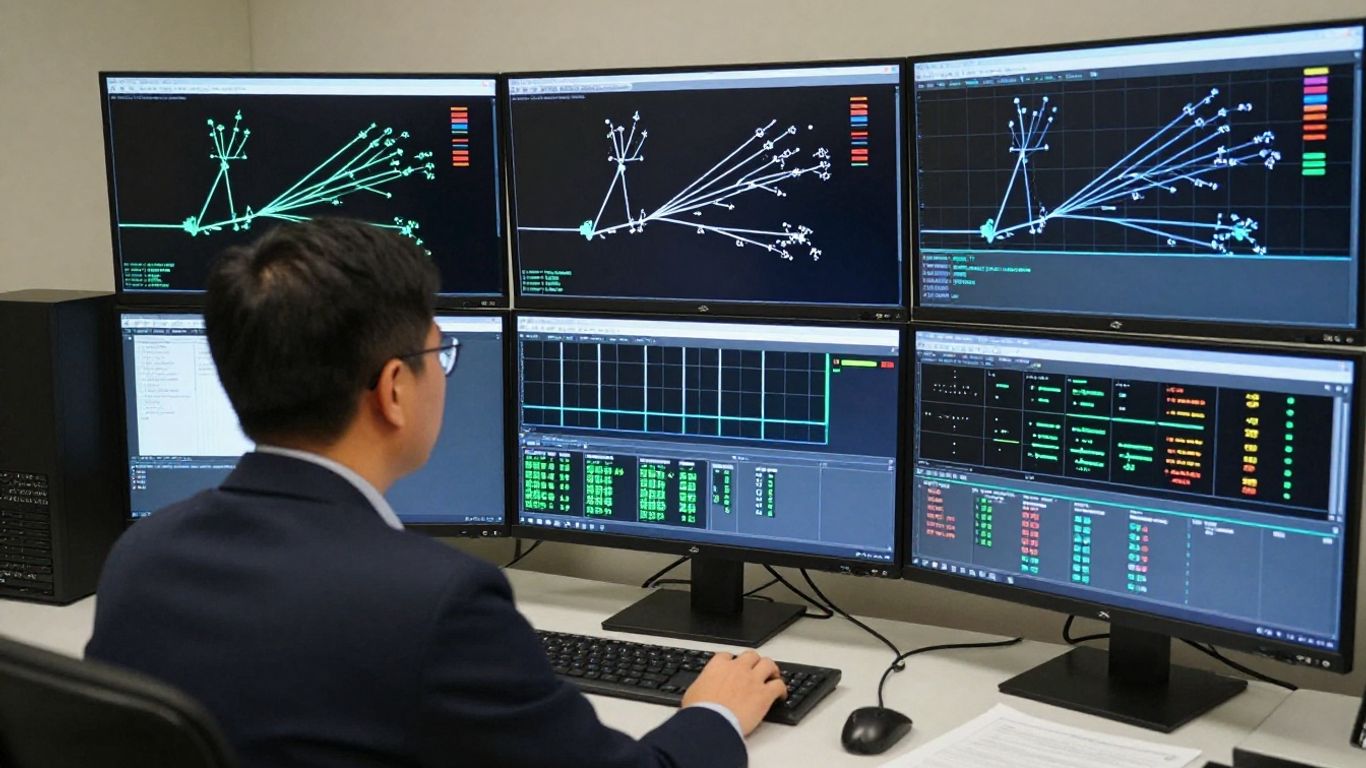
Ask whether a tool shows the complete run or only individual model requests. The useful view connects inputs, outputs, tool calls, retries, timing, and final status in sequence. It should also make it possible to filter by workflow, version, session, and failure category.
Debugging is faster when operators can move from a high-level incident to the exact event that caused it. Check how easily the tool preserves context, compares runs, and distinguishes application errors from model or dependency errors. The decision-level monitoring checklist is a useful lens for this evaluation.
Real-time alerts and incident detection
Alerts should identify conditions that need action, not simply produce more noise. Consider thresholds for error rates, latency, repeated retries, spending, unusual tool usage, and quality signals. A warning should include enough context for the recipient to decide whether to investigate immediately.
Alert routing matters as much as alert creation. Send operational issues to the people who can resolve them, define escalation paths for sensitive actions, and suppress duplicate notifications during a known incident. Start with a few high-value alerts and refine them from actual responses.
Dashboards, analytics, and reporting
A dashboard should serve different audiences without hiding the connection between them. Operators need active failures and slow steps; managers need completion, usage, cost, and trend views; reviewers may need quality samples and audit history. The underlying events should remain consistent across these views.
Before choosing a tool, write down the reports you expect to use monthly and during an incident. Useful dimensions include agent, workflow, model, environment, customer or tenant, and time period. A polished chart is less valuable than a reliable answer to a recurring operational question.
Integrations with agent frameworks and cloud platforms
Instrumentation should fit the way your agents are built and deployed. Check support for the relevant runtime, model calls, tool layer, queues, and application services. Also consider whether events can be exported or queried through interfaces your existing operations team already uses.
Integration quality affects adoption. If developers must rewrite core logic or maintain fragile wrappers, coverage will decay as the agent changes. Prefer a capture approach that preserves useful context with a small, repeatable amount of application code.
Implement monitoring in a production workflow
Monitoring works best when it is part of delivery rather than an emergency addition after launch. Define the signals, owners, retention rules, and response procedures while the workflow is still being designed. Then introduce coverage gradually, starting with the paths that matter most to customers or finances.
Instrumenting agents without slowing development
Create reusable instrumentation around model calls, tool calls, task boundaries, and errors. Keep business logic separate from telemetry code so a workflow can change without requiring a new monitoring design every time. Sampling may reduce storage for low-risk traffic, while sensitive or high-value actions can receive fuller capture.
Make the instrumented path easy to test locally. Developers should be able to inspect a trace for a known scenario without setting up a production-like investigation. Good defaults reduce the temptation to omit monitoring when delivery pressure rises.
Setting meaningful thresholds and alerts
Choose thresholds from observed baselines and business consequences. A five-second delay may be harmless for overnight research but unacceptable during a live customer interaction. Likewise, a small number of failed tasks may be serious if every failure affects a high-value transaction.
Use separate thresholds for warning and intervention, and attach a clear owner to each alert. Useful first alerts often include:
- A spike in failed or abandoned tasks.
- Repeated retries within one session.
- An unusual increase in tokens or cost per task.
- Tool errors or authorization failures above baseline.
These alerts become useful only when the team reviews them after incidents. Adjust thresholds that generate noise, and add context that helps responders act without opening several unrelated systems.
Creating workflows for investigation and remediation
An incident process should move from detection to evidence, containment, correction, and follow-up. Preserve the affected traces, identify the earliest abnormal step, and decide whether to pause a workflow, require approval, or route work to a human. The response should match the potential impact rather than the technical novelty of the failure.
Document common remedies such as updating a tool schema, correcting permissions, revising instructions, or rolling back a workflow version. Assign ownership for each workflow and record the decision made during remediation. This turns individual debugging sessions into operational knowledge.
Testing monitoring coverage before launch
A prelaunch review should verify that important paths actually emit usable events. Exercise successful tasks, timeouts, malformed tool responses, permission failures, retries, escalations, and cancellation. Then inspect the traces as an operator would, rather than assuming that an event was captured because the code ran.
Test privacy behavior at the same time. Confirm that redaction works, access is limited, retention behaves as intended, and exports do not expose protected data. A launch gate based on coverage is more dependable than a checklist that only confirms an SDK was installed.
Govern and optimize monitored AI agents
Once monitoring is running, governance keeps it safe and economically useful. The goal is controlled autonomy: agents can complete appropriate work, while people retain visibility and authority over sensitive decisions. This requires regular review of permissions, data handling, spending, and outcomes.
Protecting sensitive prompts and user data
Classify the information an agent may receive and the information it may send to tools. Store only what is needed for diagnosis and evaluation, and redact secrets before they enter logs or traces. Where full payload retention is necessary, restrict access and define a clear retention period.
Privacy decisions should follow the workflow's risk. A low-sensitivity internal task may support more detailed capture than a workflow handling customer records. Document those differences so monitoring remains consistent with the organization's data practices.
Managing access controls and audit trails
Separate the ability to view traces from the ability to change an agent, its tools, or its permissions. Give owners, developers, reviewers, and auditors the access each role requires. Record configuration changes, approvals, manual interventions, and exports so an investigation has a trustworthy history.
Ownership should be explicit for every production workflow. Guidance on managing an AI agent workforce reinforces the operational need for named responsibility and human accountability. The same principle applies whether one person runs the system or a larger team shares operations.
Reducing infrastructure and model costs
Cost optimization starts with attribution. Track usage per task, agent, workflow, and model, then look for repeated context, unnecessary loops, oversized outputs, and tool calls that do not improve the result. Distinguish normal variation from a genuine change in unit economics.
Set spending limits and escalation rules before a runaway process occurs. A cost review can then ask whether to shorten context, change a model, cache stable information, or redesign the workflow. For a deeper treatment of tracking token spend, connect usage data to operational guardrails rather than reviewing invoices alone.
Reviewing trends and improving agent performance
Schedule regular reviews of quality, reliability, latency, and cost. Look for gradual drift as data, tools, users, or instructions change. A trend review should end with a small number of experiments, each tied to a measurable outcome and a rollback plan.
Team Control takes a managed approach to deploying and monitoring AI agents, with real-time tracking of agent actions, dollars spent, and tokens used. That model can reduce the operational burden for teams that want centralized visibility without managing servers themselves. Whatever platform you choose, the durable practice is the same: observe the workflow, learn from evidence, and keep human control where it matters.
Conclusion
Choosing AI agent monitoring tools is less about collecting the most data and more about creating a clear line from agent action to business outcome. Trace the workflow, measure quality and economics together, protect sensitive information, and give people a repeatable way to investigate and improve production behavior. With that foundation, monitoring becomes part of dependable operations rather than a report generated after something goes wrong.
Frequently Asked Questions
What are AI agent monitoring tools?
They are tools and practices that capture, analyze, and alert on the behavior of AI agents, including steps, model calls, tool use, latency, cost, errors, and outcomes.
Why is monitoring an AI agent different from monitoring a regular application?
Agents make dynamic decisions and may take several actions before completing a task. Monitoring must therefore connect intermediate steps and context, not only track uptime or a final response.
Which metrics should teams track first?
Start with task success, failure rate, latency, retries, token consumption, cost per task, and high-impact safety or policy events. Add more specialized measures once those basics are reliable.
Should every prompt and response be stored?
Not necessarily. Retention should reflect the workflow's risk, privacy obligations, and debugging needs. Redaction, limited access, sampling, and defined retention periods can reduce unnecessary exposure.
How can a team detect agent hallucinations?
Use reviewed evaluation examples, grounding checks, user feedback, and targeted validators. Compare suspicious outputs with the context and sources available to the agent during that run.
What makes an alert useful?
A useful alert identifies a condition that needs attention, includes enough context to begin an investigation, and has a clear owner and response path. Alerts should be tuned against real operating baselines.
How often should monitored agents be evaluated?
Evaluate before launches and after meaningful changes to prompts, models, tools, permissions, or workflows. Continue reviewing production samples and trends so new failure patterns enter the test set.